
Understanding Consolidation Patterns in Forex Trading
In the fast-paced world of forex trading, having a firm grasp on chart patterns is essential for making informed decisions. One common pattern that traders often encounter is the consolidation pattern. These patterns emerge when Price movements enter a narrow range temporarily before resuming their established trend. Recognizing and effectively trading consolidation patterns can be highly beneficial for traders seeking to capitalize on potential breakouts.
What is the Consolidation Pattern?
The consolidation pattern in forex trading refers to a chart pattern characterized by sideways price movements within a range before a breakout in a new direction. This pattern typically arises when the Market is in a state of indecision, with neither buyers nor sellers exerting dominant control over the price.
During a consolidation phase, the market pauses, forming recognizable patterns like rectangles, triangles, or wedges. These patterns often offer valuable insights into the future direction of the price once the consolidation period concludes. Traders can leverage these patterns to identify and exploit potential trading opportunities.
Types of Consolidation Patterns
Symmetrical Triangles
Symmetrical triangles are consolidation patterns where the price forms lower highs and higher lows, creating a narrowing wedge shape. This pattern indicates a state of equilibrium resulting from indecision between buyers and sellers, with neither party holding a clear advantage.
Once the symmetrical triangle reaches its peak, it usually precedes a breakout in either direction, depending on the prevailing trend. Traders can anticipate the breakout and strategically place their entry orders based on this pattern.

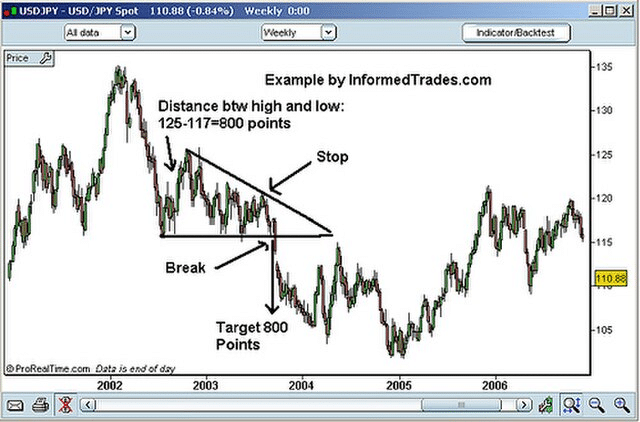
Descending Triangles
Descending triangles are consolidation patterns that slope downward, characterized by a horizontal support line and a descending trendline connecting the lower highs. This pattern suggests a potential bearish breakout below the support line as sellers become more aggressive while buyers struggle to maintain higher price levels.
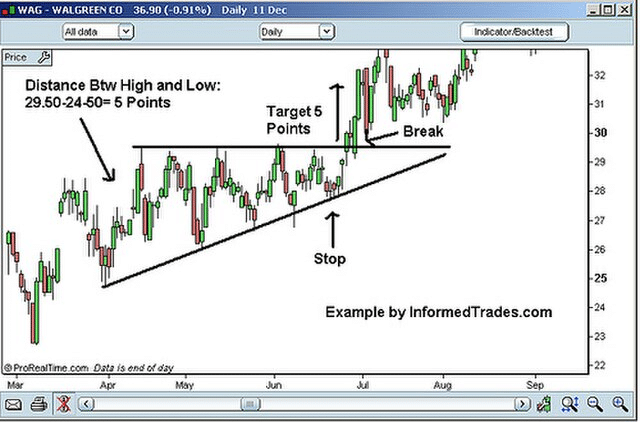
Ascending Triangles
Ascending triangles feature an upward slope with a horizontal resistance line and an ascending trendline connecting the higher lows. This pattern signifies potential bullish sentiment, indicating that the price is likely to break above the resistance line as buyers exhibit increased activity while sellers struggle to push the price lower.
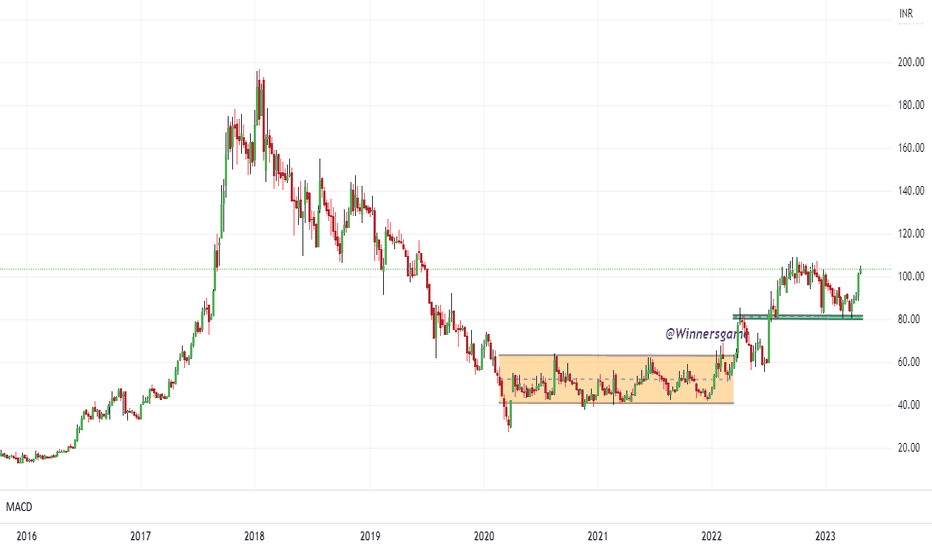
Ranges
Range consolidations occur when prices move within a defined support and resistance level, forming a horizontal trading range. Traders can identify range patterns by observing multiple swing highs and lows at similar price levels. This pattern suggests market indecision, with neither buyers nor sellers having enough momentum to push the price out of the range.
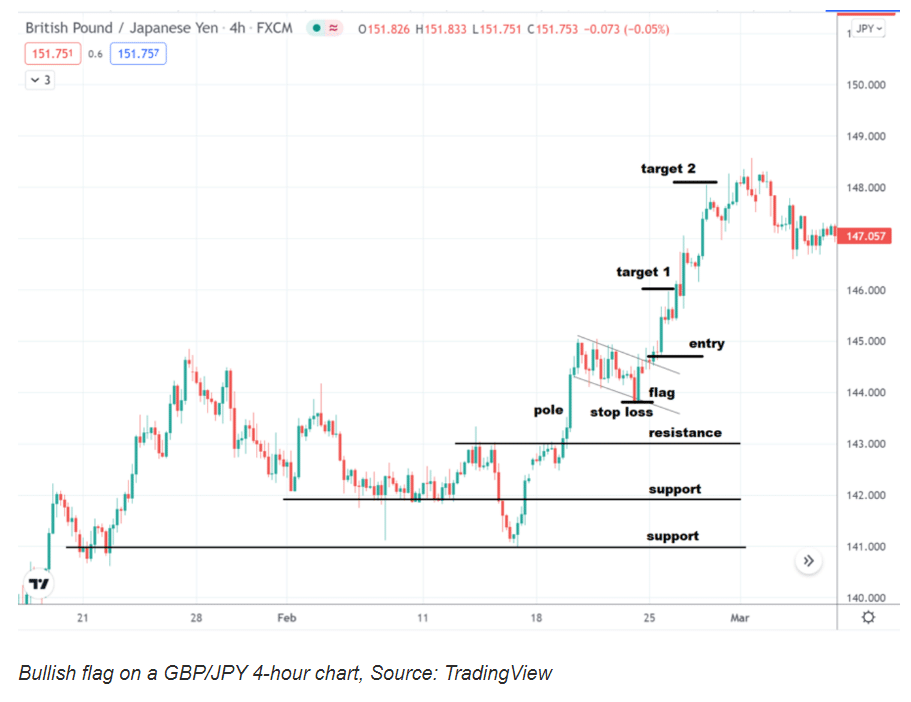
Rectangle or Flag Pattern
The rectangle or flag pattern is a consolidation pattern characterized by parallel trendlines forming a rectangle or flag shape. It typically emerges when the price moves sideways within a narrow range following a significant price movement, signaling a period of consolidation before the prevailing trend continues. Traders can use this pattern to enter positions aligned with the trend once the price breaks out of the range.
Trading the Consolidation Pattern in the Forex Market
Effectively trading the consolidation pattern can lead to profitable outcomes if executed correctly. Here are some Tips to consider:
Volume
Monitoring volume is crucial when trading consolidation patterns. As the consolidation progresses, volume typically decreases, indicating diminishing market participation and potential indecision. However, a substantial increase in volume during the breakout can confirm the strength of the breakout, making it more reliable. High volume during the breakout suggests strong participation and conviction from traders, increasing the likelihood of a successful trade.
Size of the Consolidation
Examining the size of the consolidation can offer valuable insights into the likelihood of a breakout. While the size itself does not dictate the direction of the breakout, smaller consolidations may have a higher chance of breaking out in the direction of the original trend. Smaller consolidations imply less accumulation or distribution of positions by traders, enhancing the probability of the trend continuing. However, traders should also consider other factors like volume, market conditions, and technical indicators when trading consolidation patterns.
Breakout Confirmation
A breakout confirmation acts as a signal that validates the direction of the breakout from the consolidation pattern. It can manifest as a candlestick pattern, chart pattern, technical indicator, or a combination of these. For instance, a bullish engulfing candlestick pattern, a rising wedge chart pattern, or a moving average crossover can confirm a bullish breakout from a consolidation pattern. Breakout confirmations should occur with high volume and a clear price movement beyond the boundaries of the consolidation pattern.
Risk-Reward Ratio
When trading consolidation patterns, ensure to use a favorable risk-reward ratio. Aim for a ratio of at least 2:1, meaning your potential profit should be double your potential loss. Use the size of the pattern to estimate your target and stop-loss levels effectively.
Profiting from Consolidation Patterns in Forex
Developing proficiency in trading consolidation patterns in the forex market can be a valuable asset for traders. These patterns can help identify and capitalize on breakouts in various market conditions. By understanding different consolidation patterns, employing suitable Strategies, and managing risk efficiently, traders can elevate their trading results. Continually practice and analyze your skills to navigate the forex market's numerous opportunities through consolidation patterns.
Frequently Asked Questions
Q:
Consolidation itself is neither bullish nor bearish but represents a period of market indecision. The subsequent breakout from the consolidation pattern determines the direction of the trend.
Q:
A bullish consolidation pattern refers to a period of consolidation that occurs within an uptrend. It suggests a temporary pause before the upward trend potentially continues.
Q:
Trading during consolidation can be challenging as prices move within a narrow range. Many traders prefer to wait for a breakout from the consolidation pattern to confirm the direction before entering a trade.


